
There is a lot of noise around foreign influence in politics.
Donations, trips, lobbying, declarations — the detail gets messy quickly.
So instead of getting lost in that complexity, let’s step back and ask a simpler question:
Where do UK politicians actually spend their attention?
And more importantly:
Is that attention proportional to the importance of those countries?
A Simpler Approach: Follow Behaviour, Not Claims
Rather than focusing on:
- who funded what
- what was declared
- or which group someone belongs to
this approach takes a step back.
It introduces a simple concept:
Influence Intensity
The level of political engagement directed toward a country, relative to its structural importance.
In plain English:
How much attention does a country get vs how much you would expect it to get?
How “Attention” is Measured
To keep things objective, we use a behavioural proxy:
MP Visits
Why visits?
- They require time (a scarce resource)
- They require effort and planning
- They indicate access and relationship-building
Unlike speeches or social media, visits are:
- harder to perform for optics
- easier to compare across countries
- more meaningful in terms of engagement
What Counts as “Structural Importance”
To judge whether attention is proportionate, we need a baseline.
This analysis uses three simple factors:
- Population – size of the country
- Trade – economic importance to the UK
- Strategic relevance – security and geopolitical positioning
These are not perfect, but they are:
- widely accepted
- measurable
- relatively hard to manipulate
The Three Key Views
1. Population-Adjusted
This asks:
How much attention does a country get relative to its size?

Small countries would normally receive less attention than large ones.
But that is not what we see.
2. Trade-Adjusted
This asks:
How much attention does a country get relative to its economic importance?
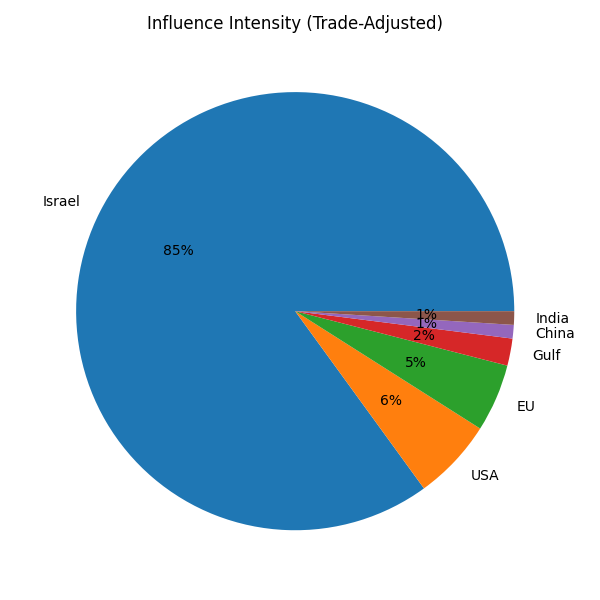
You would expect major partners like the US, EU, and China to dominate.
Again, the pattern does not fully match that expectation.
3. Composite Influence Intensity Index
This combines the factors into a single view:
Engagement ÷ (Population + Trade + Strategic relevance)
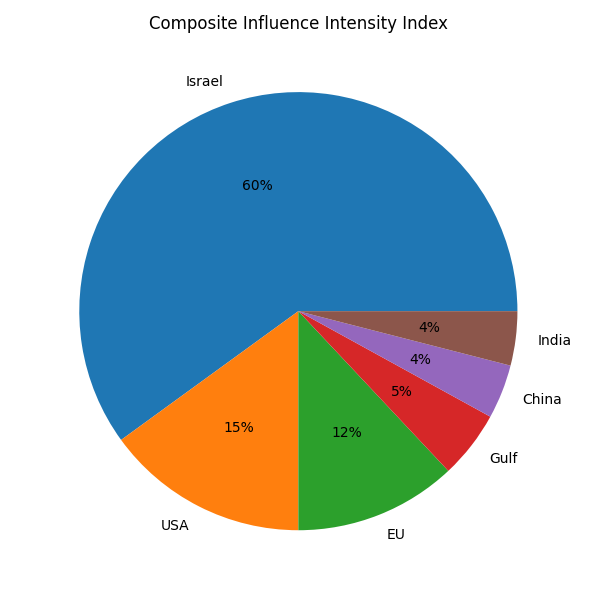
This gives a more balanced and corrected perspective.
The Core Finding
Across all three views, one pattern stands out:
Israel appears as an outlier in UK parliamentary engagement.
- It receives more attention per capita than most countries
- It receives more attention per unit of trade than major partners
- Even after combining factors, it still over-indexes
What This Does Not Mean
This analysis does not prove:
- corruption
- improper influence
- direct control over policy
There are legitimate reasons countries receive attention:
- security cooperation
- historical ties
- geopolitical alignment
- active diplomacy
What It Does Suggest
This model highlights something more subtle:
The concentration of political engagement is not evenly distributed, and in some cases exceeds what neutral factors alone would predict.
In short:
- attention is not random
- and not purely explained by size or economics
Why This Matters
Most discussions about influence get stuck in:
- accusations
- counter-accusations
- incomplete data
This approach avoids that by focusing on:
observable behaviour at system level
Not intent. Not ideology. Not speculation.
A More Useful Way to Think About Influence
Instead of asking:
“Is someone influencing politicians?”
A better question is:
“Where is political attention disproportionately concentrated?”
Because attention is:
- finite
- valuable
- often predictive of priority
Conclusion
The UK political system is both transparent and complex.
There is no single explanation for patterns like this.
But the Influence Intensity model shows something important:
Even after adjusting for key structural factors, some countries receive disproportionately high engagement.
This does not tell us why.
But it does tell us where to look more closely.
Appendix: Methodology, Mathematical Working and Sources
This appendix outlines the methodology used to construct the Influence Intensity framework.
The purpose of the model is diagnostic. It identifies patterns of political engagement that appear disproportionate relative to neutral baseline factors. It does not attempt to prove causation, intent, or improper influence.
1. Core Definition
Influence Intensity is defined as:
Influence Intensity = Political Engagement ÷ Structural Importance
Where:
- Political Engagement is proxied by observable behaviour (primarily MP visits)
- Structural Importance is derived from macro-level factors (population, trade, strategic relevance)
2. Engagement Proxy
Political engagement is approximated using:
- MP visits and delegations (primary proxy)
This was chosen because visits represent:
- allocation of time (a scarce resource)
- intentional engagement
- access to institutions and networks
This approach avoids reliance on more subjective or inconsistent measures such as speeches, media coverage, or social media activity.
3. Engagement Inputs (Illustrative Dataset)
The prototype model uses simplified comparative engagement values:
Israel   = 20
USA      = 25
EU       = 20
Gulf     = 10
China    = 5
India    = 5
Ukraine  = 8
These values are illustrative and used to test the framework. The model is comparative rather than exhaustive.
4. Population-Adjusted Model
This model measures engagement relative to country size.
Formula:
Population-Adjusted Intensity = Engagement ÷ PopulationExample inputs (millions):
Israel = 9
USA    = 330
EU     = 450
Example calculations:
Israel = 20 ÷ 9   = 2.22
USA    = 25 ÷ 330 = 0.076
EU     = 20 ÷ 450 = 0.044
Population Source: https://data.worldbank.org/indicator/SP.POP.TOTL
5. Trade-Adjusted Model
This model measures engagement relative to UK trade importance.
Formula:
Trade-Adjusted Intensity = Engagement ÷ TradeIllustrative trade weights:
Israel = 3
USA    = 180
EU     = 160
Example calculations:
Israel = 20 ÷ 3   = 6.67
USA    = 25 ÷ 180 = 0.139
EU     = 20 ÷ 160 = 0.125
Trade Source: https://www.ons.gov.uk/businessindustryandtrade/internationaltrade
6. Composite Influence Intensity Model
A composite baseline is constructed using four factors:
- Trade relevance
- Security relevance
- Diaspora relevance
- Diplomatic relevance
Each factor is scored on a simple scale and summed:
Expected Score = Trade + Security + Diaspora + DiplomacyExample:
Israel = 18
USA    = 33
EU     = 30
Final calculation:
Composite Influence Intensity = Engagement ÷ Expected ScoreExample:
Israel = 20 ÷ 18 = 1.11
USA    = 25 ÷ 33 = 0.76
EU     = 20 ÷ 30 = 0.67
A value above 1.0 indicates engagement above baseline expectation.
7. Sources
The model uses a combination of official datasets and analytical inputs.
Primary Data Sources
- World Bank Population Data: https://data.worldbank.org/indicator/SP.POP.TOTL
- UK Office for National Statistics (Trade): https://www.ons.gov.uk/businessindustryandtrade/internationaltrade
- UK Trade Statistics Book (DBT): https://www.gov.uk/government/statistics/trade-and-investment-core-statistics-book/trade-and-investment-core-statistics-book
- UK Parliament Register of Members’ Financial Interests: https://www.parliament.uk/mps-lords-and-offices/standards-and-financial-interests/parliamentary-commissioner-for-standards/registers-of-interests/register-of-members-financial-interests/
Analyst-Assigned Inputs
- Engagement values (illustrative)
- Security relevance scoring
- Diaspora relevance scoring
- Diplomatic relevance scoring
8. Limitations
- Engagement values are illustrative rather than exhaustive
- Strategic and geopolitical scores involve judgement
- Country groupings (e.g. EU, Gulf) simplify multiple states
- The model identifies patterns, not causation
9. Interpretation
This framework should be read as a comparative tool.
It identifies where political engagement appears concentrated beyond what structural factors alone would predict.
It does not explain why those patterns exist, but provides a structured basis for further investigation.